Twice the Impressions in Six Months
A measurement writeup of the search program behind More Heat More Cool, a family-run HVAC contractor in Monroe, Ohio: 146,416 → 298,939 impressions window over window, average position up 8.9 places, and three furnace keywords taken from unranked to the top three of the local tracked set — methodology, confounds, and receipts included.

- Engaged
- January 2026
- Before window
- Aug 13, 2025 – Feb 7, 2026
- After window
- Feb 8, 2026 – Aug 5, 2026
- Verified
- August 8, 2026
Every number on this page is sourced, dated, and reproducible from the listed windows.
The AI-search side of this engagement has its own measured write-up: AI Overview and AI Mode impressions up 7.6× in five months, and the cost guides behind it.
We audited moreheatmorecool.com in January 2026. The baseline report (Feb 19 – Mar 19) showed roughly 33,000 monthly search impressions and 56 organic clicks, the site's fourteen service pages were about 90% identical to one another, and in the 80-keyword local rank-tracking baseline its core furnace head terms were not ranked at all. Over the following six months we rebuilt the information architecture around a three-tier local funnel — service pages, city pages, cost pages, all fed by a working blog — and instrumented everything: 43 automation scripts, 277 structured-data blocks, and a similarity gate that now holds duplicate content at 1.3%.
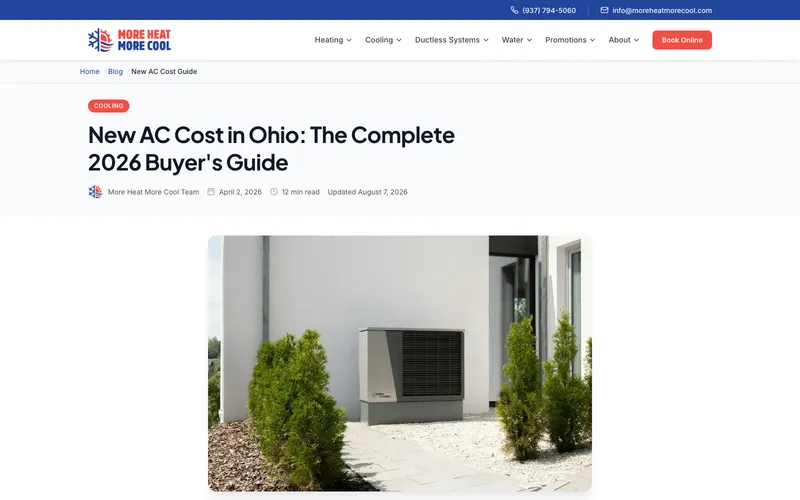
This page documents what changed, how we measured it, and what could be confounding the numbers. Search impressions doubled window over window; the year-over-year control, which holds the season constant, shows the growth is not a seasonal artifact. Positions improved while the query footprint expanded — the harder direction, since new queries usually enter low and drag the average down[1].
- Baseline (Feb 19 – Mar 19, 2026 report): 33,142 impressions, 56 organic clicks, average position 26.6.
- Fourteen service pages measured ~90% textually identical — near-duplicate content sitewide.
- No tracked local ranking for any core furnace term in the baseline snapshot (80-keyword DataForSEO set).
- The emergency page earned 9,278 impressions and exactly 1 click — visibility without clickability.
- Built the three-tier local funnel: service pages for what they do, city pages for where they do it, cost pages for the buying moment — each tier cross-linked, each page genuinely written for its place[5].
- Retargeted pages to exact-match head terms chosen from live volume and difficulty data — the furnace-maintenance page went after a 40,500-search term at difficulty 6 that the site had zero impressions for.
- Traced every zero-impression page to its missing internal links and completed the nav → service → blog → cost-hub paths.
- Drove template similarity from ~90% to 1.3% with a measurement gate that blocks deploys when duplication creeps back.
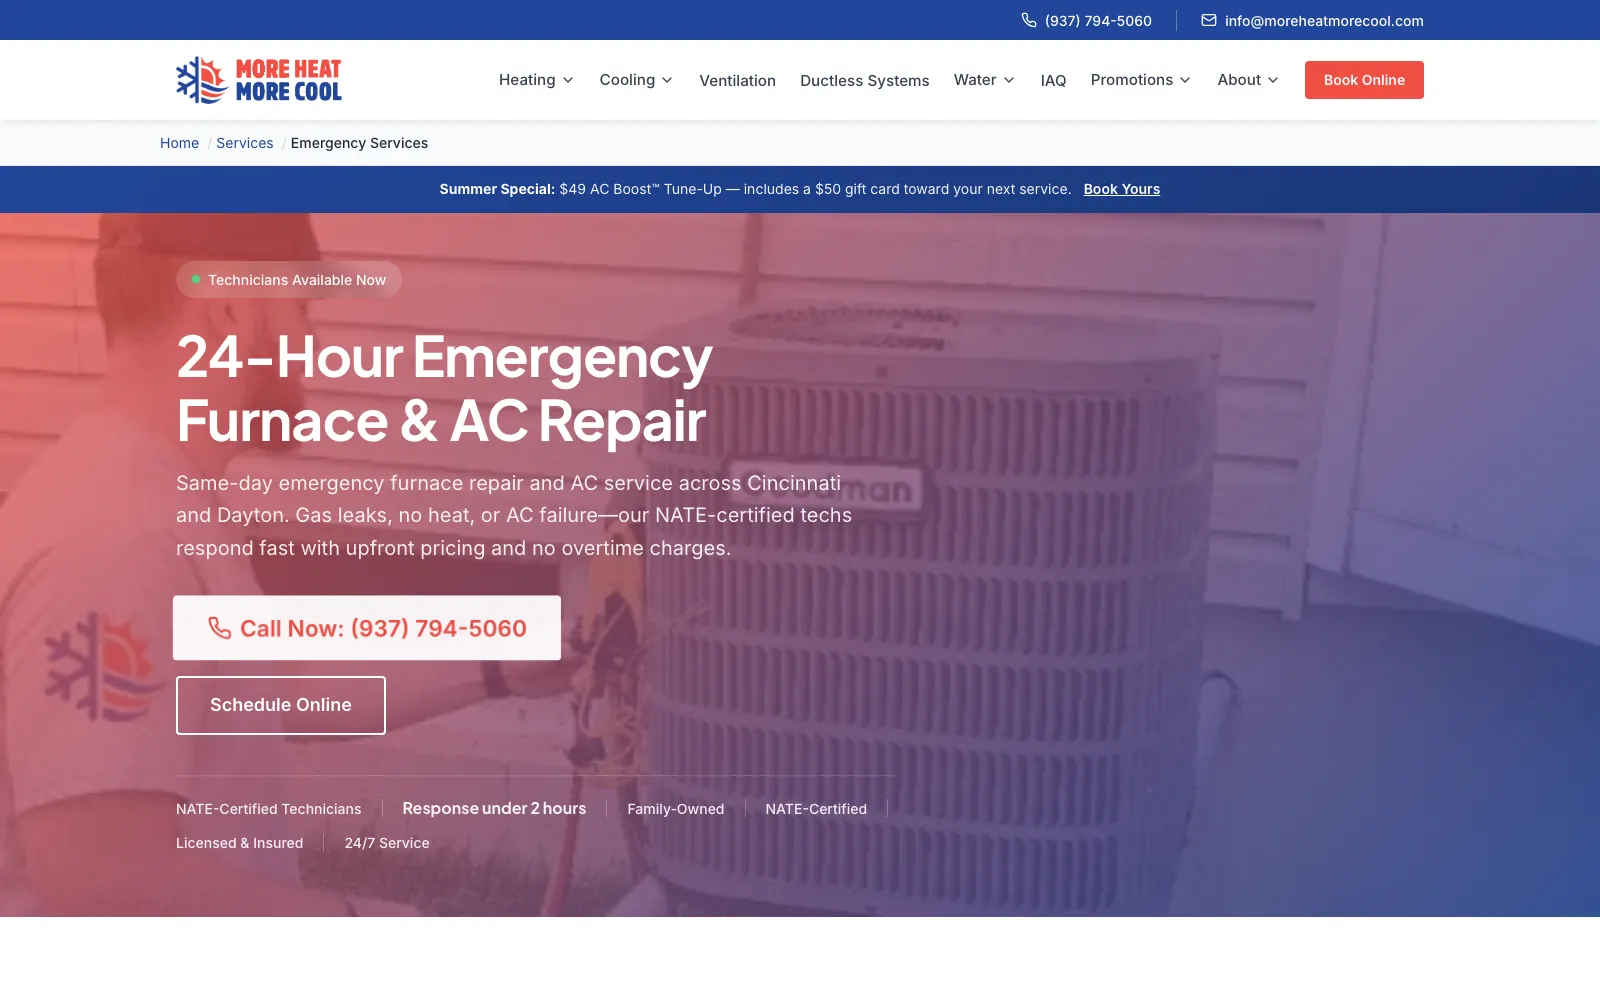
Built for the 2 A.M. Search
The emergency page carries more impressions than any other page on the site — 79,843 in the after window, up from 9,278 and exactly one click at baseline.
The rebuilt page keeps the 24/7 number in the first screenful on every device — on mobile the call button is full-width and one tap deep, because 76% of nearby-service searchers act within 24 hours[5]. Turning that visibility into clicks is the current workstream: the page sits at position 29.6, and climbing it is the plan documented under What's Next.
Captured from the live site · Aug 2026
Every Move Is Dated
The strategy is a three-tier local funnel — service → city → cost, fed by the blog — because local search intent is transactional: 46% of Google searches carry local intent[6], 76% of nearby-service searchers visit or call within a day[5], and 93% of consumers read reviews before choosing[7]. Below is the engagement log, straight from the project repo's git history. When a target is named, the volume and difficulty numbers were recorded in the commit before the work shipped — targeting first, results after.
- Jan 26, 2026
Baseline Audit
39-page SEO, responsiveness, and accessibility audit; backlog scored by impact, effort, and risk before any work shipped.
- Mar 26, 2026
Rebuilt Site Ships
Hand-coded static site replaces the old build: clean URLs, 95 redirect rules, structured data on every template.
- Jun 2, 2026
Eight-Phase Remediation
Full audit backlog cleared in one push: schema rebuilt from visible text, NAP standardized across 79 files, geo coordinates corrected on 27 pages.
- Jun 21, 2026
Topical Clustering
Service, city, and cost pages cross-linked into clusters; FAQ gaps filled against keyword data (central AC installation cost: 27,100 searches/mo, difficulty 2).
- Jul 6, 2026
40,500-Volume Retarget
Furnace-maintenance page retargeted to its exact-match head term (40.5K searches/mo, difficulty 6, zero impressions at the time). Ranked #3 by July 31.
- Jul 9, 2026
Commercial Cost Pages
Furnace-replacement-cost page for Monroe built on fresh SERP evidence that local contractor pricing pages were cracking page one against national guides.
- Jul 18, 2026
Internal-Link Recovery
Pages with zero Search Console impressions traced to missing inbound links; nav → service → blog → cost-hub paths completed.
- Aug 7, 2026
Claims Compliance Sweep
Expired federal tax-credit references removed from 26 pages; recurring claims-consistency calendar established.
Integrity notes from the same log: an automated audit's suggestion to add misleading Article markup was refused (commit 56b6529); a trialed auto-blogging tool that produced two sub-standard posts was fully rolled back within 2.5 hours; expired tax-credit claims were removed from 26 pages in the Aug 7 compliance sweep.
What Moved
Two equal 179-day Search Console windows, before and during the program — plus a same-months year-over-year control so seasonality can't take the credit.
Search Impressions by Month
Google Search Console, Aug 2025 – Jul 2026 (last full month). February 2026 spans the engagement boundary and appears in both series at its full-month total.
Queries That Moved
Impressions and average position per window. Sampled from 1,627 compared query rows by volume and relevance — including one that got worse (ac installation near me), because that is what real data looks like.
| Query | Impr before | Impr after | Pos before | Pos after |
|---|---|---|---|---|
| furnace installation near me | 422 | 2,930 | 2.6 | 1.4 |
| hvac near me | 444 | 2,262 | 4.7 | 1.6 |
| ac repair near me | 1,050 | 5,164 | 8.4 | 6.6 |
| furnace repair | 1,623 | 4,589 | 17.6 | 14.7 |
| emergency furnace repair | 2,205 | 2,643 | 38.6 | 22.9 |
| 24 hour emergency furnace repair | 331 | 2,004 | 44.0 | 16.2 |
| hvac emergency repair | 1,481 | 2,112 | 29.7 | 19.9 |
| ac installation near me | 489 | 3,564 | 2.2 | 13.5 |
Pages Doing the Work
The site’s eight biggest pages by current impressions. The homepage tripled its clicks (104 → 339) while climbing from position 40 to 11; four of the eight did not exist in the before window.
| Page | Impr before | Impr after | Pos before | Pos after | Clicks before | Clicks after |
|---|---|---|---|---|---|---|
| Homepage | 13,637 | 68,396 | 40.1 | 10.6 | 104 | 339 |
| /emergency-services | 48,450 | 79,843 | 37.9 | 29.6 | 5 | 7 |
| /air-conditioning-repair | 740 | 16,826 | 66.5 | 40.5 | 1 | 3 |
| /water-heater-repair-installation | new | 14,336 | — | 38.2 | 0 | 0 |
| /services | 3,906 | 12,364 | 64.4 | 43.6 | 2 | 2 |
| /loveland-oh-hvac | new | 12,206 | — | 22.2 | 0 | 0 |
| /monroe-oh-hvac | new | 11,177 | — | 29.0 | 0 | 3 |
| /mason-oh-hvac | new | 9,777 | — | 20.0 | 0 | 1 |
Windows: Aug 13, 2025 – Feb 7, 2026 vs Feb 8, 2026 – Aug 5, 2026 (179 days each), captured August 8, 2026 from Google Search Console[1]. Year-over-year control, Apr 8 – Aug 5 both years: 37,828 → 225,530 impressions with the season held constant. Position robustness: across the 265 queries with ≥50 impressions in both windows, impression-weighted average position improved 30.6 → 21.8.
From Not Ranked to Number One
The tracked-keyword snapshot tells the sharpest version of the story: the head terms for the client's core business went from absent to the top of page one.
- furnace installationNot ranked#1
- furnace repairNot ranked#2
- no heat near me50/mo searchesNot ranked#2
- furnace maintenance40,500/mo searchesNot ranked#3
- monroe heating and air50/mo searchesNot ranked#4
DataForSEO rank snapshot, July 31, 2026 — 80-keyword tracked set, desktop, local SERPs; every row shown was unranked in the baseline snapshot. Branded terms excluded. This is a different measurement basis than Search Console average position (see Methodology) — the two are never mixed on this page.
What Could Be Confounding These Numbers
A results page you can quote is one that audits itself. Five things that could be moving the figures besides us:
- 1Seasonality. The comparison windows straddle different demand seasons — the before window contains furnace season, the after window contains AC season, and July “AC repair” demand runs +266% over its annual baseline[8]. That is exactly why the year-over-year control exists: comparing Apr 8 – Aug 5 against the same dates in 2025, impressions still grew 37,828 → 225,530 with the season held constant.
- 2Google's June 2026 spam update landed inside the measurement window. Per Google's own core-update guidance, movement inside an update window should not be attributed to any single change[9] — our monthly report annotates the update dates rather than claiming through them.
- 3The click base is still small. 469 organic clicks in the after window. The percentages are real, but visibility has outrun clicks — position 26 earns almost nothing, because the top three results absorb 54–69% of all clicks depending on the study and the SERP layout[2][3][4]. Converting impressions into clicks is the current workstream, not a solved problem.
- 4Mobile performance is unfinished. The July 2026 report scores mobile lab performance at 59/100. A June remediation cut the tested template's LCP dramatically, but the monthly mean is still high and we are not claiming a speed win.
- 5Paid channels ran alongside. Roughly half of total site traffic in July came from paid campaigns. Every number on this page is filtered to organic Google Search only — paid traffic cannot inflate impressions, clicks, or position in these figures.
How We Measure
Impressions, clicks, CTR, and average position follow Google's published definitions[1]. An impression means a link to the site was served in results a user saw or could have seen; average position is the topmost position of any link to the property, averaged across queries — so it moves when the query mix moves, not only when rankings do.
Two measurement bases appear on this page and are never blended. Google Search Console average position covers every query the site appeared for (1,627 compared rows in these windows). DataForSEO tracks a fixed 80-keyword set on local desktop SERPs, snapshotted daily. A number's basis is named wherever it appears.
Window definition: the measurement window opens Feb 8 — six months before capture, chosen by the calendar, not by us. The engagement's first artifact is the Jan 26 audit, and the rebuilt site deployed March 26 — so roughly six weeks of the after window predate any shipped change, which understates the post-deploy effect if anything. The windows are equal 179-day spans, and the before window includes the site's August 2025 impression spike, which raises the baseline we compare against.
| Source | What it provides | Freshness |
|---|---|---|
| Google Search Console | Impressions, clicks, CTR, position — all windows on this page | Data through Aug 5, 2026 |
| DataForSEO rank tracking | 80-keyword tracked set, desktop, local SERPs | Snapshot Jul 31, 2026 |
| Published client reports | Baseline (Feb 19 – Mar 19) and July 2026 monthly report | Generated Aug 3, 2026 |
| Project repository | Dated commits, targeting rationale, validation gates | Continuous |
What We're Going After Next
- The HVAC-repair cluster. Roughly 167,790 monthly searches at an average difficulty of 11.8 where the site currently records zero impressions — the largest untouched target on the board.
- Impressions → clicks. The emergency page holds 79,843 impressions at position 29.6. The CTR curve is brutally top-heavy — one position gained is worth roughly a third more clicks[2] — so the next phase is climbing the pages that already have the visibility.
- Mobile performance. Lab scores are still mid-pack; the remediation plan is in the maintenance calendar, and we'll publish the numbers when they're worth publishing — not before.
Two Ways In: Call or Estimate
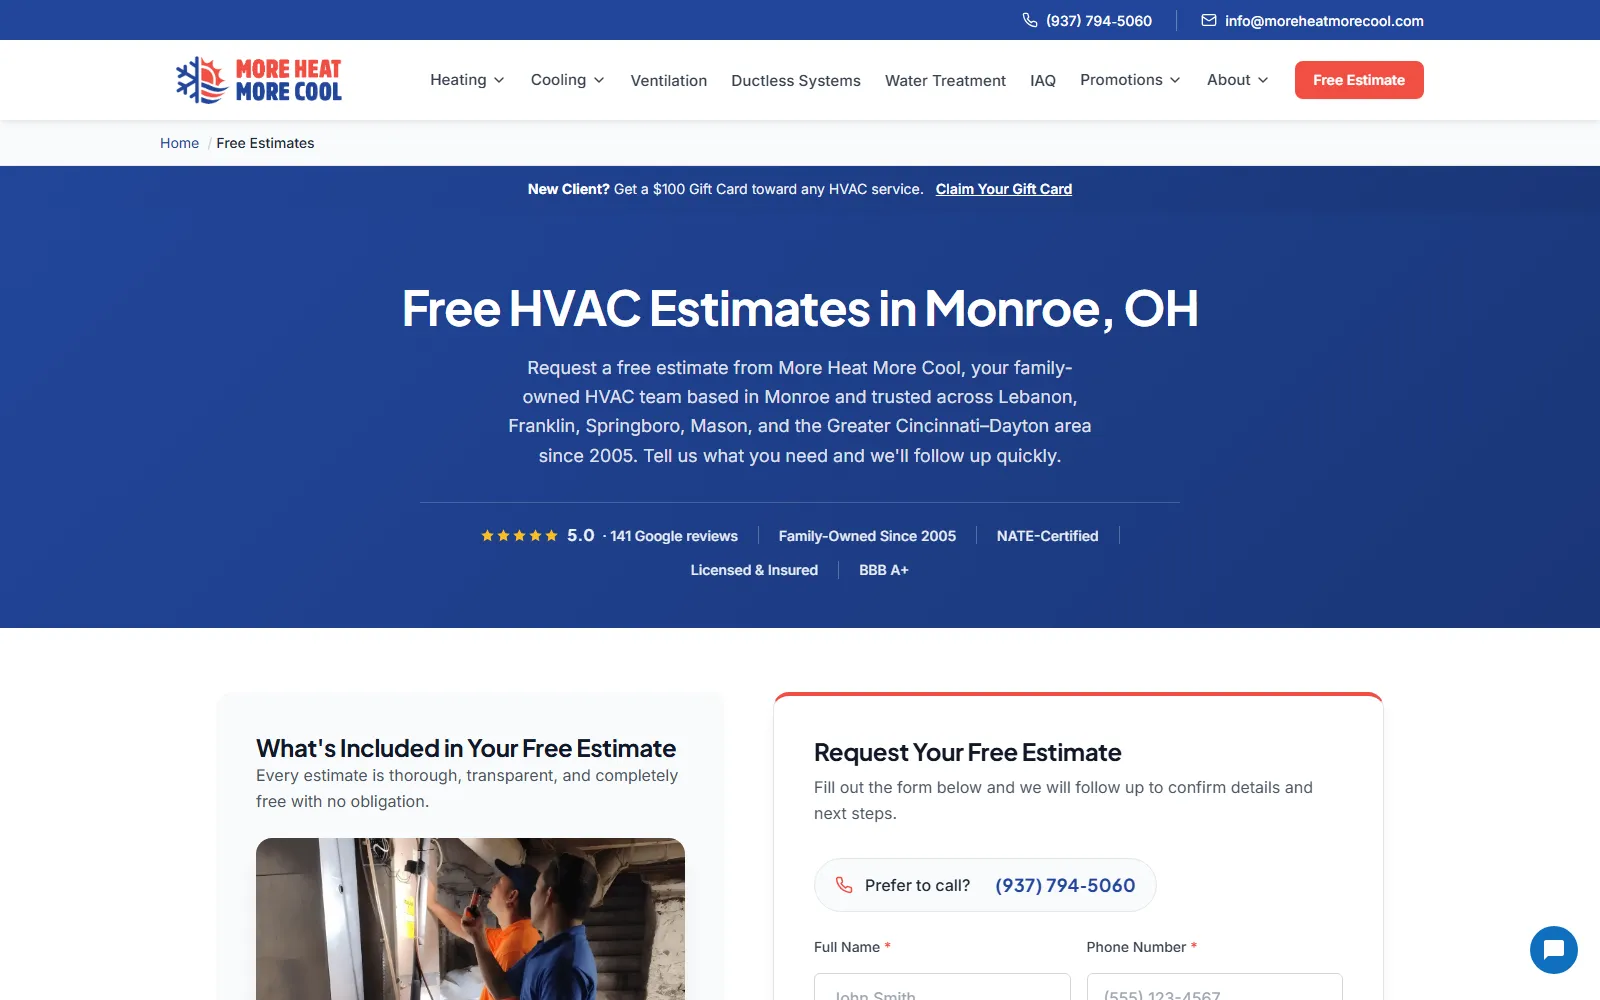
Emergency HVAC happens on a phone. Urgent visitors get the 24/7 number in every header; everyone else lands in the free-estimate flow that fills the schedule between emergencies.


Third-party statistics cited above. Client-specific figures come from the sources in the Methodology table; the underlying Search Console views were captured with the owner authenticated on Aug 8, 2026.
- 1.
Performance report metric definitions (impressions, clicks, average position, CTR). Google Search Console Help · accessed Aug 2026
- 2.
Google organic CTR by position — #1 earns 27.6% of clicks; the top three earn 54.4%. Backlinko (4M-result study, updated 2025) · accessed Aug 2026
- 3.
Position-1 CTR ranges 13.7–46.9% depending on SERP layout. SISTRIX (80M-keyword study) · accessed Aug 2026
- 4.
Google click-through rates by ranking position, 2026 edition. First Page Sage · accessed Aug 2026
- 5.
76% of people who search for something nearby visit a related business within 24 hours. Think with Google · accessed Aug 2026
- 6.
46% of Google searches carry local intent; 42% of local searchers click the Maps pack. Backlinko local SEO statistics · accessed Aug 2026
- 7.
93% of consumers read online reviews before visiting a business; 83% read them on Google. BrightLocal Local Consumer Review Survey 2025 · accessed Aug 2026
- 8.
“AC repair” search demand peaks in July at +266% of its annual baseline; “furnace repair” peaks in January at +137%. WebFX seasonal home-services search study (Ahrefs data, Dec 2025) · accessed Aug 2026
- 9.
Core-update guidance: movement inside an update window should not be attributed to any single change. Google Search Central · accessed Aug 2026
Let's talk about what a bespoke build would look like for your business.
More Heat More Cool: AI Search